

Spotlight on Demographics:
Target middle-aged Japanese
women with in-store clothing inspiration
as they shop for children, significant
others, and themselves.
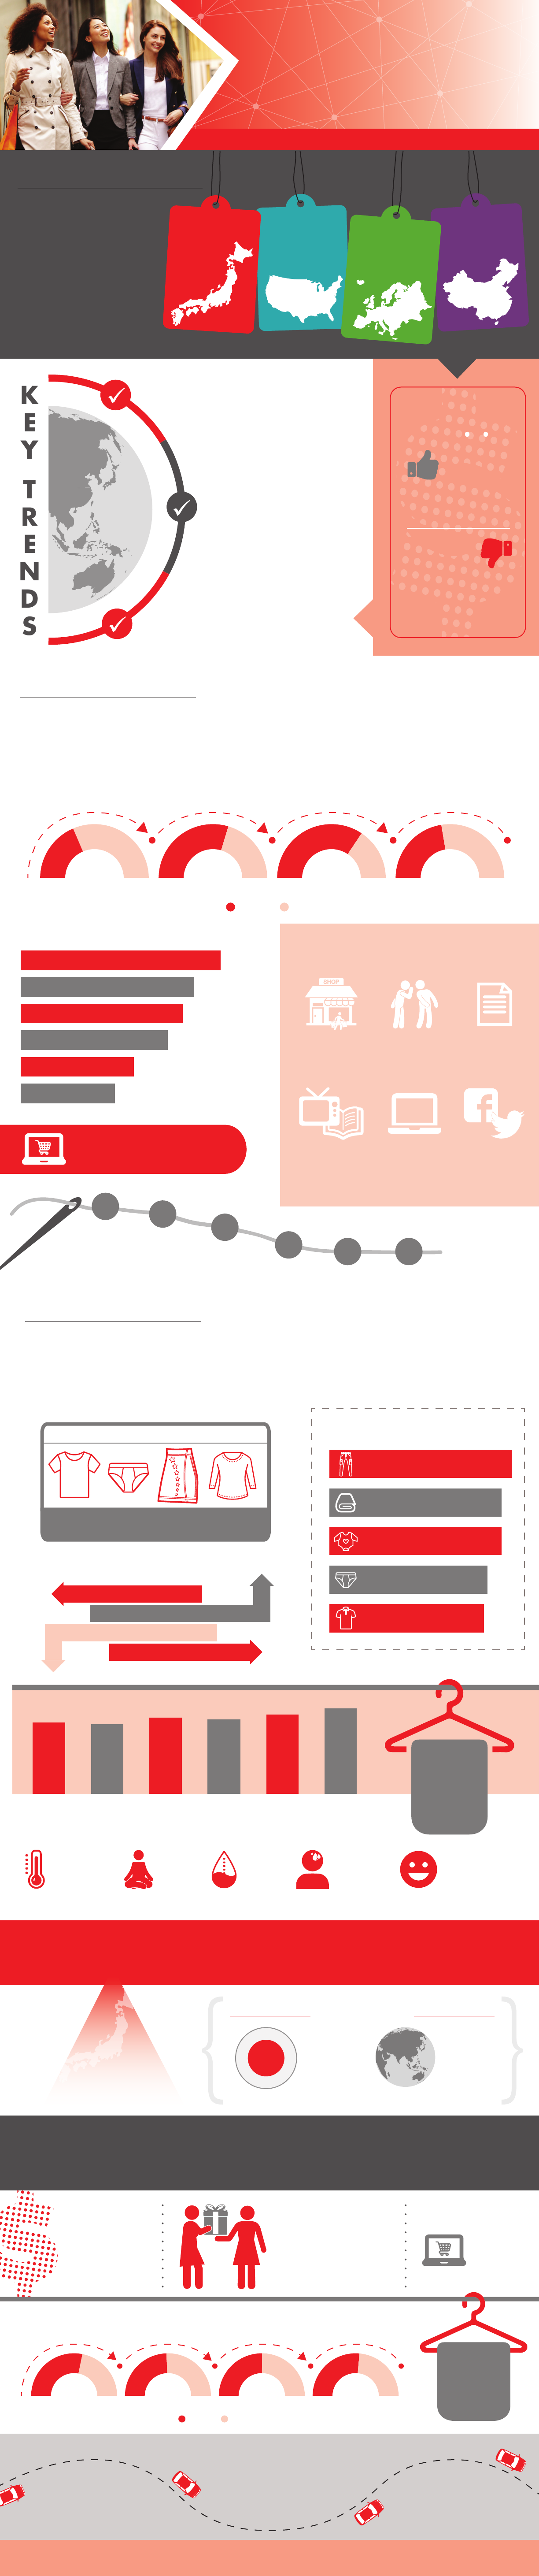
GLOBAL CONSUMER
INSIGHTS
GLOBAL LIFESTYLE MONITOR: JAPAN
Japanese consumers spent a
robust $89.6 billion on
clothing in 2017. With a
declining population, this
number is expected to shrink
8% by 2030. Brands &
retailers can gain an edge in
this competitive market by
understanding their needs
and shopping habits.
APPAREL SPENDING
What They Shop: Seize
opportunities to meet consumer
needs for price-conscious,
comfortable clothing without
sacrificing quality.
FINANCIAL
OUTLOOK
36% 56%
OPTIMISTIC
How They Shop: Help consumers make
informed purchases with online product
information and expert in-store advice for
a seamless shopping experience.
US
$338.9
+56% growth
CHINA
$277.2
+193% growth
EU
$374.5
+52% growth
JAPAN
$89.6
¹
-8% growth
PESSIMISTIC
Japan Global
28% 11 %
Japan Global
*”Neither Optimistic/Pessimistic”
not shown
HOW THEY SHOP
Japan is a highly connected country, with 90% of the population using the internet weekly and more
mobile phone accounts than people (130 accounts per 100 individuals)
²
. They use this connectivity to
research clothing online before going to physical stores to make purchases, spending more of their
shopping journey online than consumers globally. Reach these consumers with an active online presence
combined with engaging, informative in-store experiences.
36% 59% 69% 45%
clothing research pre-purchase questions purchase repeat purchase
in-store online
SHOPPING JOURNEY
RETAIL STORES SHOPPED FOR CLOTHING
DISCOUNT 53%
46%
43%
39%
30%
25%
SPECIALTY
ONLINE ONLY
CHAIN
FACTORY
DEPARTMENT
41%
40%
34%
28%
27% 27%
APPAREL SHOPPING HABITS
Buying on Impulse
2008
2010
2012
2 014
2016 2018
SOURCES FOR
CLOTHING IDEAS
Window
Shopping
46%
33%
Shop online at
least 1 time a month.
Other
People
43%
Store
Publications
32%
Traditional
Media
29%
Brand & Retailer
Digital Resources
29%
Social
Media
18%
Consumers who prefer in-store shopping
BABYWEAR
72%
WHAT THEY SHOP
As Japanese consumers’ personal financial outlook has steadily risen from 13% optimism in 2010 to 36%
in 2018, they are more likely to choose quality over price when purchasing clothing. While still
price-conscious, consumers look for comfort, color, and fit when shopping for clothing and are intrigued
by clothing with performance features to help monitor and address physical processes such as
perspiration and hydration.
TOP ITEMS OWNED
COTTON PREFERRED FIBER
PAY MORE FOR BETTER QUALITY
PERFORMANCE APPAREL
UnderwearT-shirts Skirts Casual Shirts
1011 7 6
PRIMARY PURCHASE DRIVERS
PRICE 70%
COMFORT 64%
COLOR 64%
FIT 61%
2008
45%
2010
44%
2 012
48%
2014
47%
2016
50%
2018
54%
Likely to Purchase
HOME TEXTILES
72%
40% 39% 33% 27%
Regulate Body
Temperature
Relieve
Stress
Monitor
Hydration
Monitor
Perspiration
25%
Manage
Mood/Emotions
71%
prefer cotton or
cotton blends
for their
most-worn
clothing
INTIMATES
68%
PANTS
76%
Average Number
SHIRTS
67%
Consumers would like to know prior to purchase
79%
prefer cotton or
cotton blends for
their most-worn
clothing
JAPAN’S MIDDLE-AGED
WOMEN CONSUMERS
SPOT
LIGHT
With the second highest median age in the world, companies in Japan increasingly look to target older
consumers, many of whom are women. Nearly half of Japanese women 45+ are optimistic about their
personal financial circumstances, and 54% regularly purchase clothes for others. Reach these consumers
with in-store clothing inspiration and details about items’ quality, fiber content, and laundering.
Source: Cotton Council International and Cotton Incorporated’s Global Lifestyle Monitor Survey, a biennial consumer research study. In the 2018
survey approximately 10,000 consumers (i.e. 1,000 consumers in 10 countries) were surveyed. External Source: ¹Euromonitor International ²World
Bank ³CIA World Factbook
47.3 30.4
³
MEDIAN AGE
FINANCIAL
OUTLOOK
43%
OPTIMISTIC
SHOP FOR OTHERS SHOP ONLINE
SHOPPING JOURNEY
PURCHASE DRIVERS
47% 56% 72% 50%
clothing research pre-purchase questions purchase repeat purchase
in-store online
Japan Globally
54% 33%
All
Consumers
25%
at least
one time
a month
Women
44-54
QUALITY
60%
55%
Women 45-54
All Consumers
FIBER CONTENT
48%
39%
Women 45-54
All Consumers
LAUNDERING
45%
32%
Women 45-54
All Consumers
Percentage of middle-aged women who prefer in-store shopping